Background
As part of an experimenting project I am transforming code that I initially wrote for simulating traffic on a road network into a threaded version.
Initial Threading
Initial threading of the removing of cars in sinks (road network exits) yielded a longer run time for the threaded version. Most likely the issue is the limited number of vehicles and only two sinks.
With this aspect of the project I worked with java.util.concurrent Executors and pooled task execution using maximum/free pool size, a fixed pool size and a pool handled by a single thread.
Using implements Runnable simulation runs: 5 Simulated run time: 600 seconds
| Serial time: 0.29 Serial time: 0.222 Serial time: 0.202 Serial time: 0.205 Serial time: 0.2 | Threaded time: 1.866 Threaded time: 1.275 Threaded time: 1.202 Threaded time: 1.273 Threaded time: 1.122 |
Changed up some data structures ConcurrentHashMap and tweaked the code in terms of variable scope.
Using fixed thread pool size of 2 Following result:
| Serial time: 0.276 Serial time: 0.199 Serial time: 0.16 Serial time: 0.161 Serial time: 0.162 | Threaded time: 1.335 Threaded time: 0.914 Threaded time: 0.846 Threaded time: 0.837 Threaded time: 0.876 |
A thread pool size = 2 performs about the same or slightly better than a threadpool size = 1
A thread pool size of > 2 yields worse results than equal to 2.
So overall, this result is somewhat disappointing. After some discussion with my advising professor I set about profiling the code.
Setup Profiling
After some initial research, I decided to give the TPTP project a try. Primarily since it is part of the overall Eclipse program and installs into the environment.
| TPTP Page | |
| How to install from within Eclipse | |
| How to setup your project | http://www.eclipse.org/tptp/monitoring/documents/tutorials/tptp_btm_setup_4.3.html |
If there is a lot of information for the profiler to process it will consume quite a bit of CPU and leave Eclipse unresponsive while it is processing. For my project five simulation runs for 60 seconds would leave you with an unresponsive environment and the need to kill the application. Understand, that since this project is an exercise in threading that there are many threads and pools. A single 60 second simulation run yields 2400 pools with several threads each.
Profiling
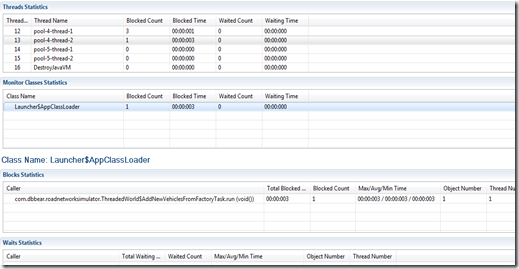
The initial thread statistics, blocked time/count and deadlocked time/count show the trouble spots.
Under Monitor statistics, you can drill down further. Now I have a really good idea of what code needs further inspection.
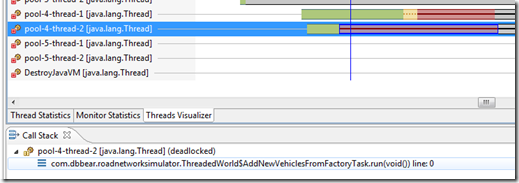
Switch to Threads Visualizer
The blue line corresponds to time in the application. I had to zoom the time scale to make the trouble area visible.
Red indicates deadlocked, yellow indicates blocked. By looking at the call stack we can determine the problem area.
Run times for this sample: Simulating 60 seconds Threaded time: 0.048 Serial time: 0.0030
I wanted to try out CyclicBarriers and explicit use of Threads with .start() and .join() to see if there were any significant differences from the pooled task approach. The biggest issue for me with both of these approaches is that you need to keep explicit track of either the number of threads or keep a reference to the thread so you can issue the join(). I did notice that the Thread approach seemed to leave Threads running. Wondering if I needed another join().
Ultimately I settled on a hybrid of serial code and java.util.concurrent Executors. Timing numerous runs also indicated that at least for my application Executors where going to be the right approach. Especially since the type and size of the thread pool is configurable.
Post Profile
After copious time spent using the profiler to analyze and adjust the threaded code I now have the following results:
| Serial time: 0.23 Serial time: 0.143 Serial time: 0.114 Serial time: 0.099 Serial time: 0.11 | Threaded time: 1.383 Threaded time: 0.889 Threaded time: 0.843 Threaded time: 0.831 Threaded time: 0.785 |
Note that the serial times have dropped. This is a byproduct of a shared base class that was tweaked along the way. In order to fairly evaluate serial versus threaded code it is important that the serial code be optimized.
The threaded times are about the same as before. However, the big difference is that the profiler is now indicating no deadlocks and minimal blocking. To achieve this I changed some data types and adjusted the thread pools used by each method. Now three of the five methods are using newCachedThreadPool which creates as many threads as needed/possible. removeVehiclesInSinks() is now use a newSingleThreadExecutor and I switched to serialUpdateFactories because I was running into blocking/deadlock problems.
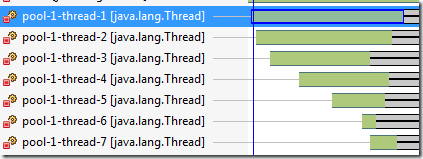
Nice visual of thread pool execution:
Note the lag between the creation of thread pools versus execution times:
Busy
I still wasn’t happy with the serial code being faster than the threaded code. However, no I knew from looking at the profiled code that threading overhead was significant for the “toy” problem. So, I thought, what if the methods took longer to run? In a prior exploration with C# Task parallel computing I had created a “busy” method. To accomplish the same sort of effect I added in a Thread.sleep(1) to the VehicleLocationCollection::update(). That's a sleep 1ms in an often used method.
Here's the result:
Simulation runs: 5 Simulated run time: 60
| Serial time: 4.811 Serial time: 4.818 Serial time: 4.818 Serial time: 4.796 Serial time: 4.807 | Threaded time: 2.625 Threaded time: 2.518 Threaded time: 2.523 Threaded time: 2.49 Threaded time: 2.509 |
Simulation runs: 5 Simulated run time: 600
| Serial time: 58.564 Serial time: 59.062 Serial time: 58.865 Serial time: 59.021 Serial time: 59.399 | Threaded time: 30.445 Threaded time: 30.108 Threaded time: 30.084 Threaded time: 31.013 Threaded time: 37.486 |
I'm glad I thought to make one of the more often used methods more intensive. To me, this shows that there is indeed an improvement over the serial version when the application crosses a threshold of compute intensity/time versus threading overhead.
Summary
When comparing serial versus parallel code they should both be optimized. I started with a working serial implementation and transformed it into a threaded version. Both versions inherit from a common base class. Unit tests help verify expected behavior. When transforming to threaded code I found myself using a top down approach. Methods which iterate over a collection are an easy target for extracting the interior loop body into a method to run as a task. Transformation of related data structures to thread safe data types is essential. Try to minimize or eliminate the need for locking/synchronized code. Too much locking and you just created threaded code which runs in a sequential manner at best.
The TPTP project profiling tool is very useful for profiling threaded applications. You can quickly identify code that is deadlocked, blocked or waiting. Your efforts can then be focused appropriately.
Threading is only beneficial once you have enough work to pay the overhead penalty. Sometimes you are better off using the serial implementation. ForkJoinTasks take that approach, they fork the problem until it is small enough to process efficiently in a serial way. The Executors class gives the developer a lot of flexibility in fine tuning the type of thread pool: unlimited, fixed or single.
Good luck in your threading endeavors!


No comments:
Post a Comment